How to Run a Charging Speed Test on Your Phone
Your charger's box says 45W, so you assume that is what your phone should be pulling every time you plug in. Most people never learn the number their own phone is actually rated for, and fewer still know that the peak figure on any charger is not a number a phone is designed to hold for an entire session. A proper charging speed test starts by fixing that gap, not by staring at a single reading and guessing.
Quick answer: A phone's charging speed only means something when you measure it against its own rated wattage, not the number printed on a charger. Confirm your phone's rated wired and wireless wattage from the manufacturer's spec sheet, then run a repeatable charging speed test using a fixed battery-percentage band, screen off, at a stable room temperature of about 20C to 25C (68F to 77F). Expect the wattage to peak at low battery and taper sharply above 70 to 80 percent, since lithium-ion cells charge with a fast constant-current phase followed by a slower constant-voltage taper. If your averaged readings sit well below what other owners of the same model report under similar conditions, the cable, charger, wall port, or battery wear is the more likely explanation, not a defective phone.
What you'll learn
- How to find the wired and wireless charging wattage your phone is actually rated for
- Why the peak wattage on a charger's box is never the number your phone sustains for a full charge
- How temperature and battery percentage change the wattage reading you see at any given moment
- How to run a charging speed test that produces numbers you can actually compare session to session
- How to tell whether your phone or your accessory is the outlier compared to the same model
Find the Number You Should Actually See
Before you can judge whether your phone is charging fast enough, you need a target. That target lives on your phone manufacturer's own spec sheet, not on the charger box. A 65W or 100W brick only tells you the charger's ceiling. Plenty of phones rated for far less than that will never draw anywhere close to it, no matter how powerful the charger is.
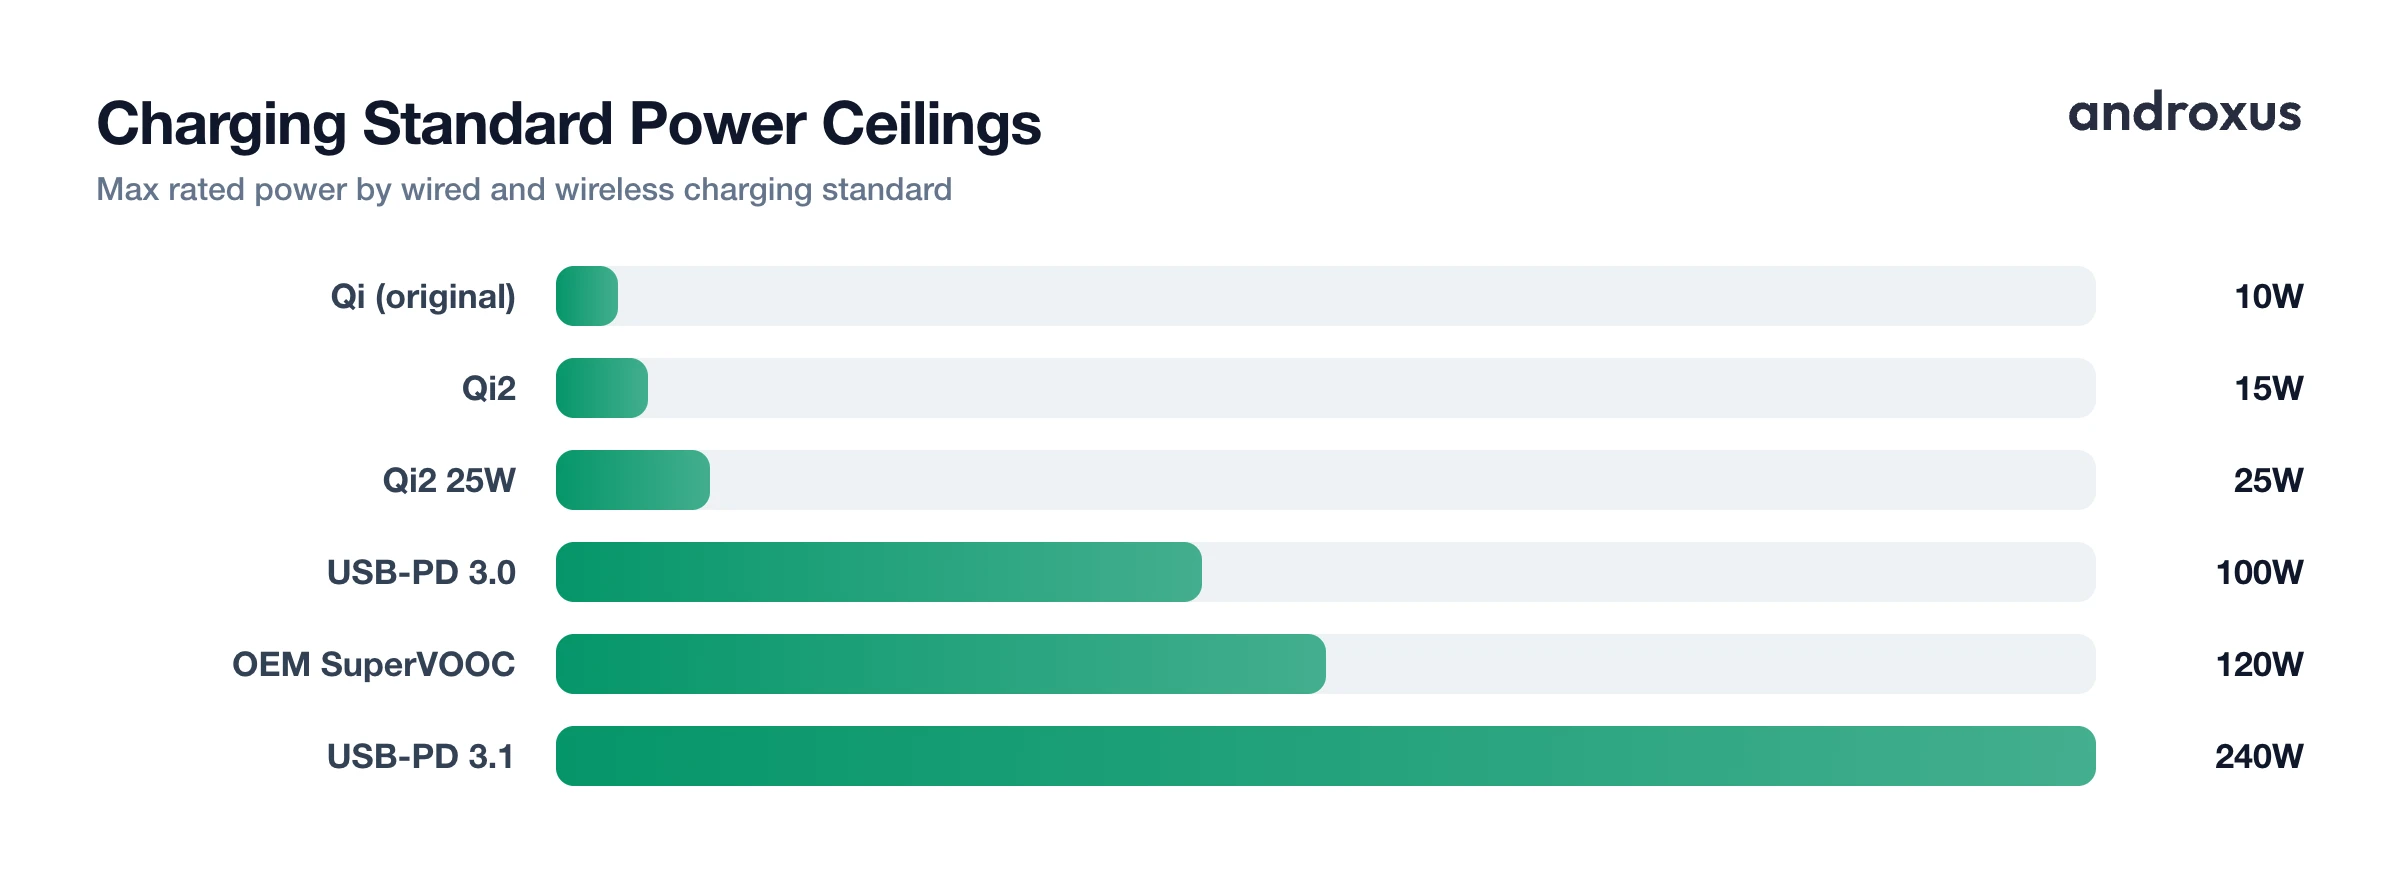
Standard wired fast charging runs on USB Power Delivery (USB-PD). USB-PD 3.0, ratified in 2017, defines fixed voltage rails of 5V, 9V, 15V, and 20V up to 100W, plus PPS (Programmable Power Supply), which adjusts voltage in 20 mV steps between roughly 3.3V and 21V for finer, cooler charge control. USB-PD 3.1, from 2021, added Extended Power Range: fixed rails at 28V, 36V, and 48V at 5A, raising the ceiling to 240W, along with AVS (Adjustable Voltage Supply) adjusting in 100 mV steps. That top tier is mostly built for laptops, though some higher-power phone chargers now use it too.
Wireless charging has its own separate ceiling. Original Qi capped most phones around 7.5W to 10W. Qi2, from 2023, added the magnet-aligned Magnetic Power Profile up to 15W. A newer Qi2 25W revision, often called Qi2.2, raises the ceiling to 25W on phones such as the Galaxy S26 Ultra, Pixel 10 Pro XL, and iPhone 16 and later.
Many Android makers layer a proprietary scheme on top of, or instead of, standard USB-PD. OnePlus SuperVOOC, for example, is rated up to 80W to 120W wired on the OnePlus 15. These proprietary numbers only appear with the manufacturer's own charger and cable, so a generic PD charger will cap out lower even if its own rating on paper looks higher.
| Standard | Introduced | Voltage rails | Max rated power |
|---|---|---|---|
| USB-PD 3.0 (SPR) | 2017 | Fixed 5V / 9V / 15V / 20V, plus PPS (about 3.3V to 21V in 20 mV steps) | 100W |
| USB-PD 3.1 (EPR) | 2021 | Adds fixed 28V / 36V / 48V at 5A, plus AVS (100 mV steps) | 240W |
| Qi (original) | 2010 | Inductive, phone-side capped by device | 7.5W to 10W (device dependent) |
| Qi2 (Magnetic Power Profile) | 2023 | Magnet-aligned inductive coil | 15W |
| Qi2 25W (Qi2.2) | 2025 | Magnetic Power Profile, inductive | 25W |
| Proprietary OEM fast charging (e.g. OnePlus SuperVOOC) | Varies by manufacturer | Manufacturer-specific, requires matching charger and cable | Up to 80W to 120W on current OnePlus models |
It also matters where you take the reading. A charger tester, an inline USB power meter sitting between the cable and the phone, reads voltage and current at the connector. A phone-side reading reports what the phone's own circuitry actually delivers to the cell. These two numbers can legitimately differ, since they measure different points in the circuit, and neither one is "wrong."
Why the Peak Number on the Box Is Never the Sustained Number
Lithium-ion phone batteries charge in two phases, generally referred to as CC-CV. A Constant Current phase pushes current at roughly a 0.5C to 1C rate until the cell reaches about 4.2V, then a Constant Voltage phase holds near that voltage while current tapers down, often to around 0.1C, to avoid overvoltage stress and heat. Many cells reach roughly 60 to 80 percent of capacity by the time the Constant Current phase ends, which means the rated peak wattage is really a low-battery-percentage phenomenon, not a number the phone sustains for the whole charge.
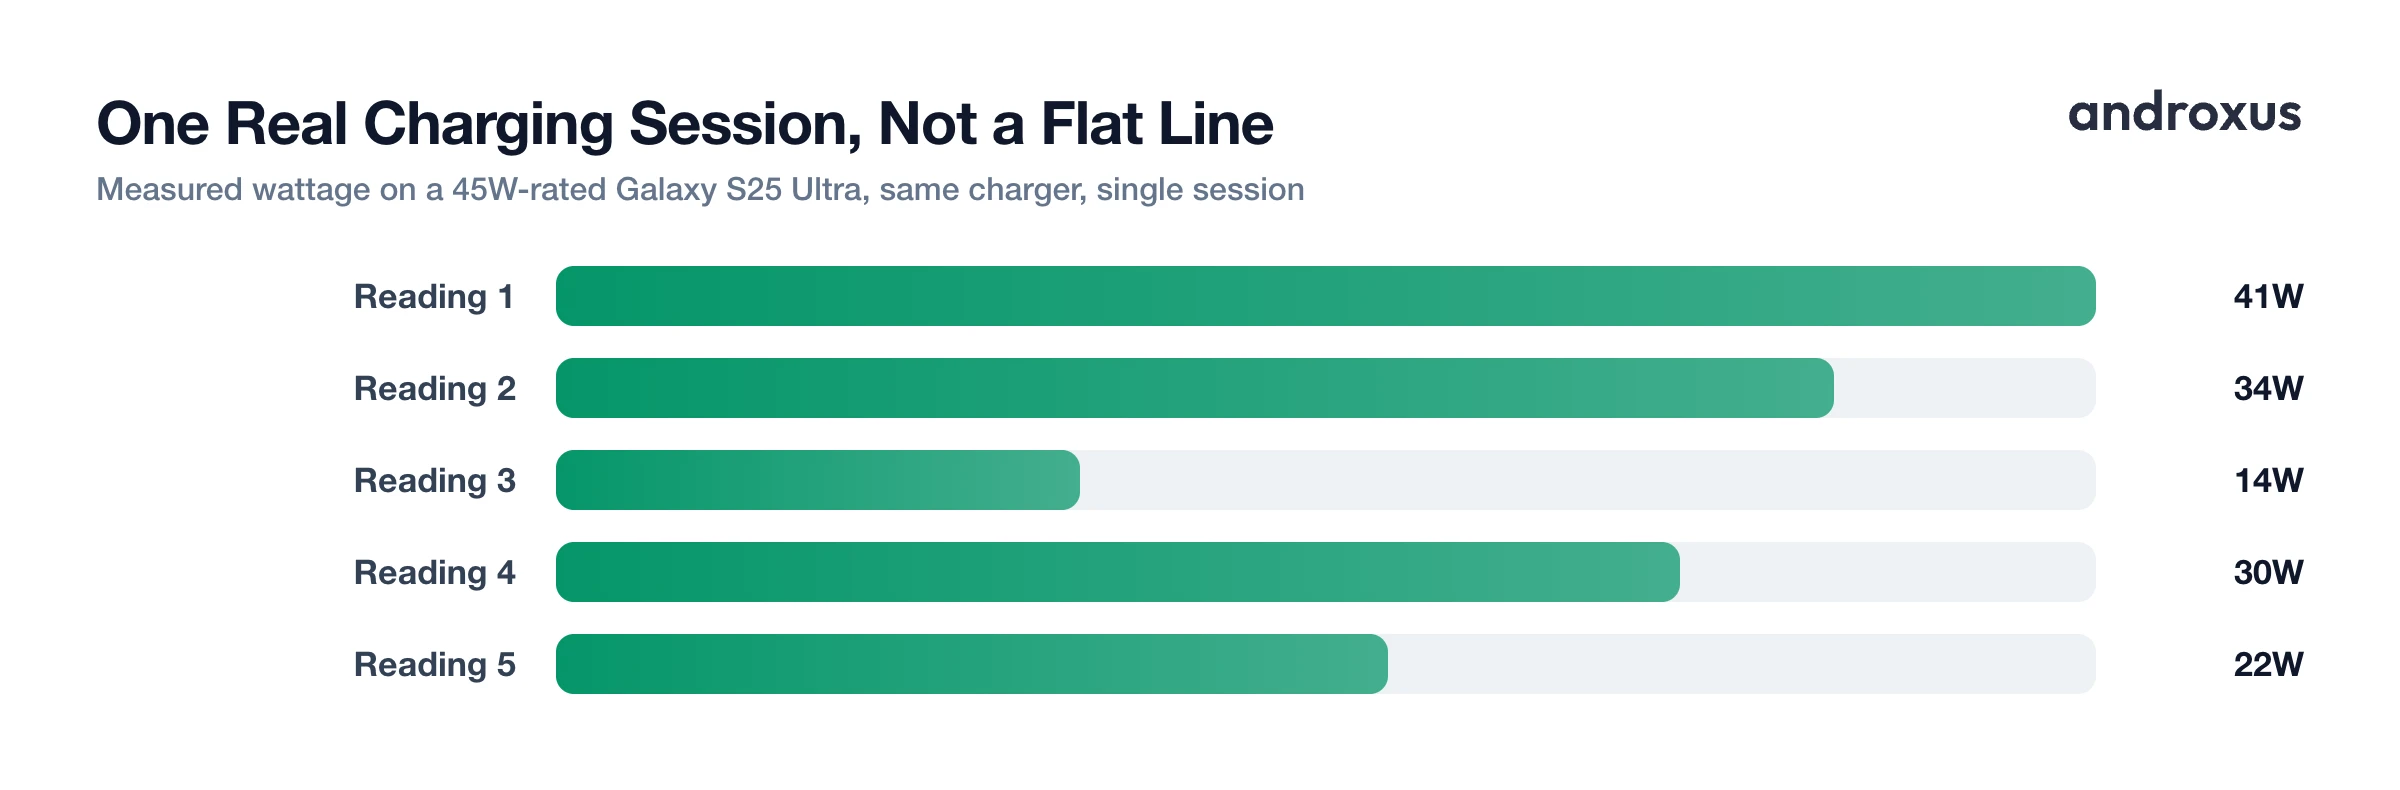
This taper is exactly why identically rated phones show a falling wattage curve in independent lab tests rather than a flat line. One review of the 45W-rated Samsung Galaxy S25 Ultra measured output starting around 41W, dropping to 34W, then 14W, then rising back to 30W before dropping to 22W, all within a single charging session on the same charger. That is not a malfunction. It is the charge controller doing its job.
The practical takeaway is that a rated wattage is a ceiling reached briefly at low charge, not an average. The number that actually determines total charge time is the effective average wattage across the full 0 to 100 percent session, and that number is always lower than the headline figure on the box. Seeing a lower reading at 70 percent battery than at 20 percent battery on the exact same charger is expected behavior built into the battery's charge controller, not a sign that anything is wrong with your phone.
What Makes a Charging Speed Test Fair
Two readings only mean something if the conditions behind them match, and two variables move the number more than anything else: temperature and battery percentage.
The broadly accepted manufacturer-safe charging range for lithium-ion cells is 0C to 45C (32F to 113F), with fast charging generally permitted between about 5C and 45C (41F to 113F). Below 0C (32F), charging risks lithium plating on the anode, a permanent capacity and safety issue, which is why charge current is reduced below roughly 5C (41F) and blocked outright at freezing. Above 45C (113F), electrolyte breakdown accelerates, so phones deliberately throttle charging current to protect the cell. The same phone will measurably charge slower in a hot car, in direct sun, or inside a thick case than in an air-conditioned room. The generally cited optimal range for both charging speed and long-term battery health is about 20C to 25C (68F to 77F).
Battery percentage matters just as much. Charging wattage is highest in the low state-of-charge band, commonly 10 to 40 percent, and falls automatically as the phone approaches 80 to 100 percent, consistent with the CC-to-CV taper described above. A reading taken at 15 percent battery in a warm pocket is not comparable to a reading taken at 60 percent battery in a cool room. Both variables have to match before two numbers mean anything side by side.
A few other confounds are worth ruling out first. Android's Doze mode does not engage while a device is connected to a charger, and a charging device gets unrestricted background access regardless of its App Standby bucket, so background app activity generally is not what skews a charging speed test, temperature and screen state are the bigger factors. It also helps to know that Android's raw current_now battery value is not consistently signed across manufacturers; some devices, including documented cases on Xiaomi MIUI builds, report a negative value while charging instead of positive. A single raw OS reading should be treated cautiously rather than taken at face value for exactly this reason.
Compare Your Unit Against the Same Model in the Real World
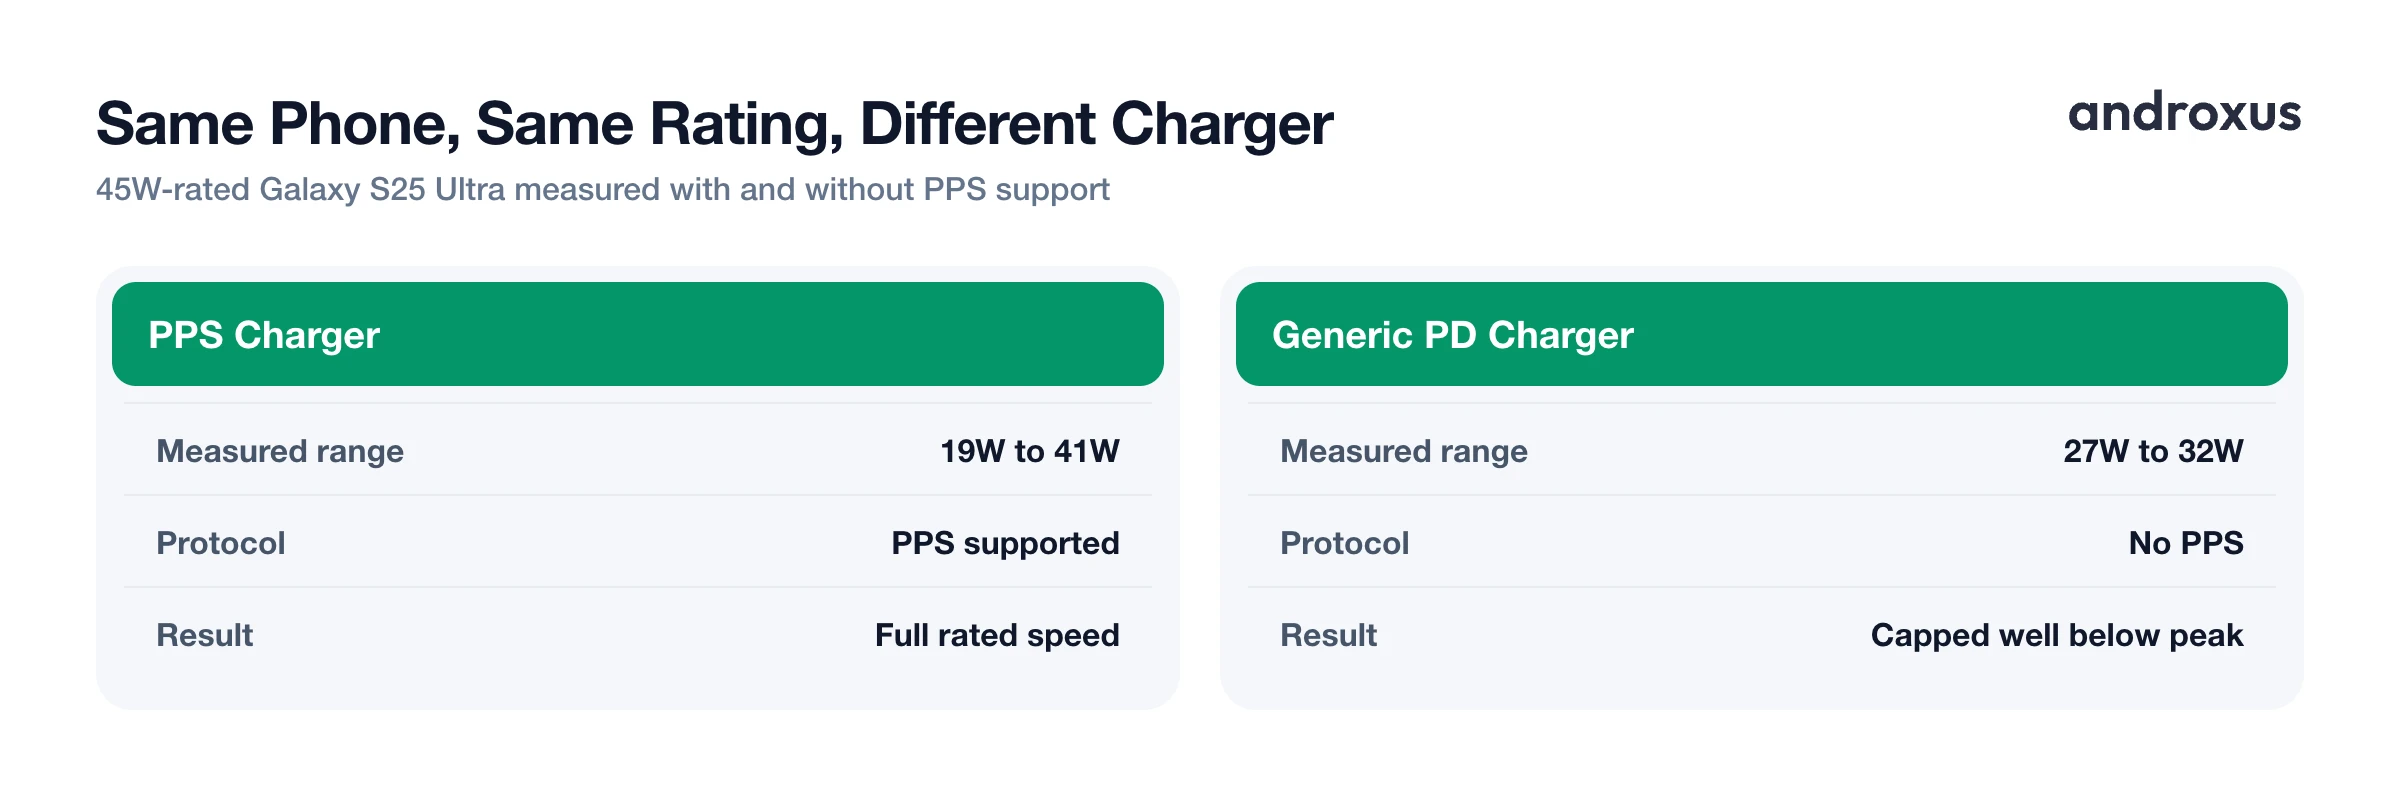
Once you have a number from a fair test, the next question is whether that number is actually good for your specific phone. This is where a same-model comparison beats a spec sheet, because independent charging tests on identical phone models often show a real spread even at the same rated wattage. The 45W-rated Samsung Galaxy S25 Ultra has been measured anywhere from about 19W to 41W depending on whether the charger supports the PPS protocol the phone needs, with generic 45W PD chargers lacking PPS support delivering only about 27W to 32W.
If your own unit charges meaningfully below what other same-model owners report under matched conditions, same charger model, same battery band, similar ambient temperature, the outlier is more likely the cable, the charger, the wall port, or a worn battery than a defective phone. This is a different exercise from a generic slow-charging checklist, since it requires a same-model baseline of what other identical units actually measure, not just the manufacturer's peak marketing number.
Battery age plays into this too. Lithium-ion cycle life is typically rated to 300 to 500 full charge cycles before capacity falls to about 70 to 80 percent of original. A unit with a high cycle count or degraded battery health will show lower real-world wattage and shorter sustained fast-charge windows than a newer unit of the same model, independent of which charger is used. A feature that ranks a device's measured charging power against other phones of the same model, such as the device ranking in AmpereFlow, is built specifically for this comparison. It shows where your unit falls relative to other owners of that model rather than relative to the spec sheet's peak number.
It is worth being precise about scope here. This kind of comparison covers only the phone's own battery, reported through its own operating system. It does not extend to connecting to, pairing with, or controlling external battery management hardware, such as e-rickshaw, EV, scooter, solar, or lead-acid battery packs. AmpereFlow reads your phone's own battery data; it does not interface with that kind of external BMS hardware at all.
How to Run a Charging Speed Test on Your Phone
- Find your phone's rated charging wattage. Look up the wired wattage, supported USB-PD version or PPS support, and wireless standard (Qi, Qi2, Qi2 25W) on your phone manufacturer's official spec page, not the number printed on your charger. This is the ceiling you are actually testing against.
- Pick a fixed battery-percentage band. Choose a start and stop point, such as 20 percent to 50 percent, and use that same band on every test run. Charging wattage falls on its own as the battery fills, so comparing readings from different percentage bands is not a fair comparison.
- Control screen state and room temperature. Turn the screen off during the test window and test indoors at a stable temperature of roughly 20C to 25C (68F to 77F), away from direct sun, heaters, or a padded case. Both variables independently change the wattage number.
- Keep the cable, charger, and port constant across runs. Use the same cable and the same wall port for every repeat test. Swapping any of these introduces a new variable, since a marginal cable or a loaded multi-port charger can throttle output on its own.
- Log two to three full sessions. Record wattage across the full charge session rather than a single glance, using a charge-history or session-replay feature if you want the full curve captured automatically, then average the readings instead of trusting one moment.
- Compare against other owners of the same model. Check your averaged readings against what other owners of the identical phone model report under a comparable charger and battery band. If your unit sits well below that baseline, the cable, charger, wall port, or battery wear is the more likely explanation, not a fixed flaw in the phone itself.
Key takeaways
- Your test target is your phone's own rated wattage from the manufacturer, not the number printed on the charger box.
- The peak wattage on any spec sheet is a brief, low-battery figure, not a number the phone sustains across a full 0 to 100 percent charge.
- Temperature and battery percentage both move the wattage reading independently, so a fair test fixes both before comparing numbers.
- Two phones of the same model can genuinely charge at different speeds depending on charger protocol support, cable quality, and battery wear.
- A same-model comparison, run under matched conditions across two or three sessions, tells you more about your specific unit than the spec sheet ever will.
Frequently asked questions
What is a normal charging speed for my Android phone?
It depends on the phone's rated wattage, which you should confirm on the manufacturer's own spec sheet rather than assume from the charger box. Flagship Android phones commonly range from 15W to 45W peak wired charging under standard USB-PD, while phones with proprietary fast-charging schemes can rate up to 80W to 120W or higher. In every case, the average wattage sustained across a full 0 to 100 percent charge is meaningfully lower than that peak number, because charging tapers as the battery fills.
Is my phone charging slow, or is this normal taper behavior?
Slower charging near the end of a session is normal. Lithium-ion phones charge using a Constant Current phase, fast, up to about 60 to 80 percent capacity, followed by a Constant Voltage phase where current tapers down, often to about 0.1C, to protect the cell from overvoltage and heat. A wattage reading that drops sharply above 70 to 80 percent battery reflects this built-in taper, not a fault, so compare readings only within the same percentage band.
Does a hot phone charge slower?
Yes. Lithium-ion cells have a manufacturer-safe charging range of roughly 0C to 45C (32F to 113F), with fast charging typically permitted between about 5C and 45C. Above roughly 45C (113F), phones deliberately throttle charging current to slow electrolyte breakdown and manage heat, so a phone in direct sun, a hot car, or a thick case will measurably charge slower than the same phone in a cool room.
Is it normal for two phones of the same model to charge at different speeds?
Yes, and it is common. Independent lab tests on the same phone model with the same rated wattage have measured real-world spreads of nearly 2x depending on whether the charger supports the required protocol, such as PPS, cable quality, and even household circuit voltage sag from other appliances. Battery wear from cycle count also lowers real-world wattage over time. If your unit sits well below what other same-model owners report under matched conditions, suspect the charger, cable, or battery health rather than a fixed phone defect.
How do I run a charging speed test correctly?
Fix a consistent battery-percentage band, for example 20 percent to 50 percent, and reuse it every time, since wattage naturally falls as the battery fills. Turn the screen off, test at a stable room temperature around 20C to 25C (68F to 77F), and keep the same cable, charger, and wall port across repeat runs. Log at least two to three sessions before concluding a number is representative, since a single session can be skewed by a one-off thermal event.
Can a charger tester or an app make my phone charge faster?
No. A charger tester, an inline USB power meter, and a phone-side monitoring app both measure and report charging data, they do not change it. Actual charging speed is set by the phone's hardware, the charger and cable's supported standard, the battery's chemistry and health, and ambient temperature. Apps like AmpereFlow read and display your phone's own battery data, including live watts, charge time estimates, and how your unit compares to others of the same model, but they cannot boost, optimize, or increase how fast a phone charges.
